This project aimed to understand the governing mechanisms behind weld hardness in laser-welded titanium sheets. Hardness measurements indicate increasing hardness with increased heat input and grain size, which is inconsistent with the general knowledge on hardness behavior. To understand this phenomenon, the oxygen content is measured in the fusion zone using EDS and XRD analyses. A greater amount of oxygen is detected in the fusion zone for samples with higher heat input. Results shows that while increased heat input increases the grain size, it also causes a greater chance of oxygen contamination by increasing the melt pool size.
Research Highlights
- A novel study was conducted on the simultaneous effects of fusion zone oxygen content and weld bead geometry on hardness and porosity of laser-welded commercially pure titanium sheets
- For investigating this project, micro-hardness tests, optical microscopy (OM), energy dispersive spectroscopy (EDS) and X-Ray Diffraction (XRD) analyses were performed.
Challenge
The dominant challenge in the realm of laser materials processing of titanium alloys including laser welding lies in the meticulous management of gas shielding during the process. Titanium, known for its sensitivity to oxygen absorption, demands an exceptional level of gas protection to avert undesirable consequences. The quest for an ideal shielding mechanism is complicated by the paradoxical nature of the welding process—where even the best shielding methods may inadvertently introduce oxygen into the fusion zone. Recognizing the potential impact of oxygen on weld properties, particularly hardness and brittleness, becomes very important.
Our Solution
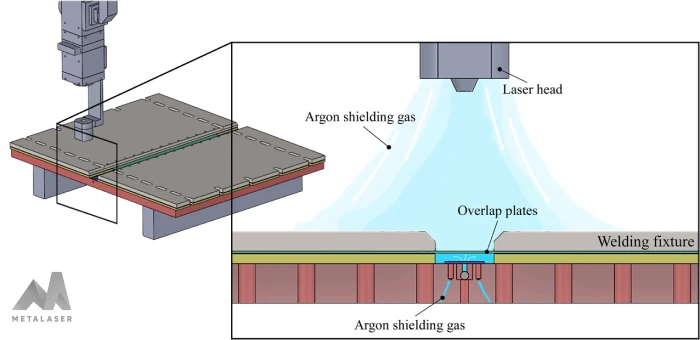
In this project, the focus extends beyond the singular challenge of oxygen control to a broader exploration of how oxygen interacts with other pivotal parameters. A comprehensive analysis is conducted, juxtaposing the influence of oxygen with variables such as heat input and grain size. We investigate the simultaneous effects of microstructure refinement and fusion zone oxygen contamination on the hardness of titanium laser welding process to see which one has higher impact on the weld. Several samples are designed and laser-welded based on different levels of heat inputs using the shielding system that is shown in Figure 2.
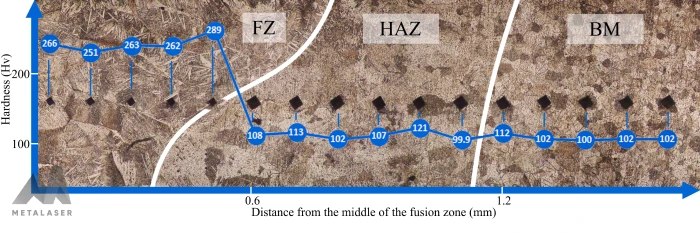
The micro-hardness of these samples was measured to observe hardness variations based on the heat input (an example is demonstrated in Figure 3).
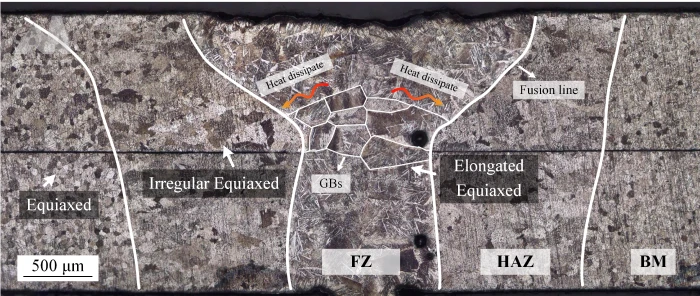
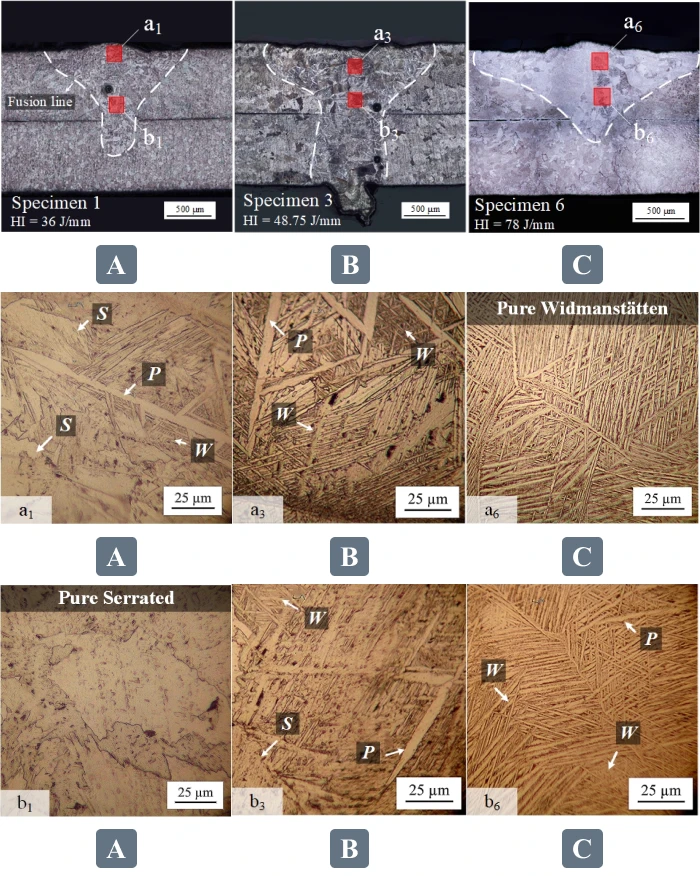
The microstructure features including grain size and morphology are analyzed accordingly. The cross section of specimens 1, 3, and 6 are shown in parts A, B, and C of Figure 4, respectively. It is apparent that the microstructure of the specimen 6 has included more Widmanstätten structure compare to specimen 3, and 1.
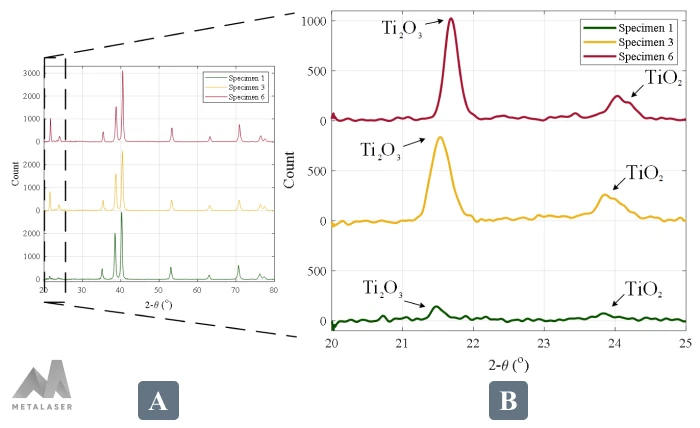
The fusion zone oxygen content and resultant secondary phases are also measured (using XRD analysis depicted in Figure 5) to compare the combined effect of grain refinement and oxygen contamination on weld embrittlement.
Outcome
- A novel study was presented to analyze the effect of the fusion zone oxygen contamination and weld bead geometry on the hardness and porosity of laser-welded commercially pure titanium sheets.
- Fusion zone characteristics including weld micro-hardness, microstructure (morphology and grain size), oxygen contamination, geometry, and porosity were measured and studied in detail.
- A general understanding was provided on the simultaneous effect of heat input (also its resultant grain size) and fusion zone oxygen content on the hardness of titanium laser-welded parts.